ENC Bathymetry Plotter
For production of ENCs, High-Density ENCs (HD ENCs), bENCs
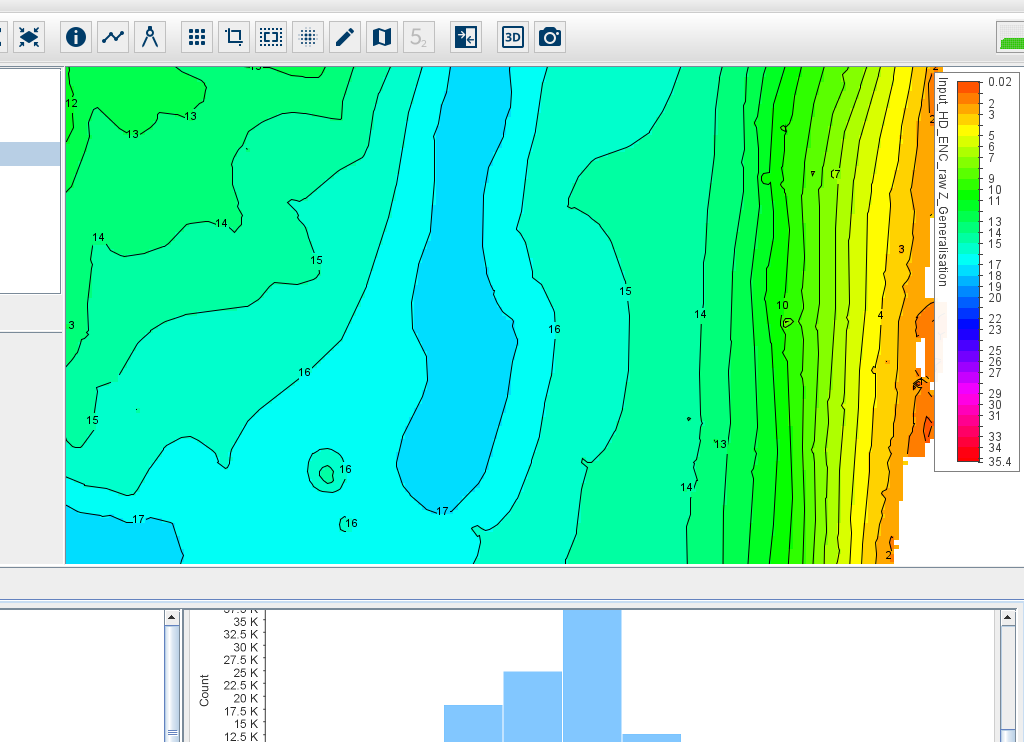
The ENC Bathymetry Plotter is used to create contour lines and selected soundings, for integration into ENCs or other digital hydrographic chart products. Point-cloud or gridded bathymetry data, serving as input, is processed and transformed into a so-called Nautical Elevation Model. A Nautical Elevation Model is a shoal-biased, smoothed-out underwater terrain model.
The result of the process of creating a Nautical Elevation Model can be imagined as draping a sheet over a rough and bumpy surface, to make it appear much smoother. The user can define the degree of generalisation to suit the desired scale of the final chart product. Within the above analogy, increasing the generalisation factor means strengthening the tension of the draped sheet.
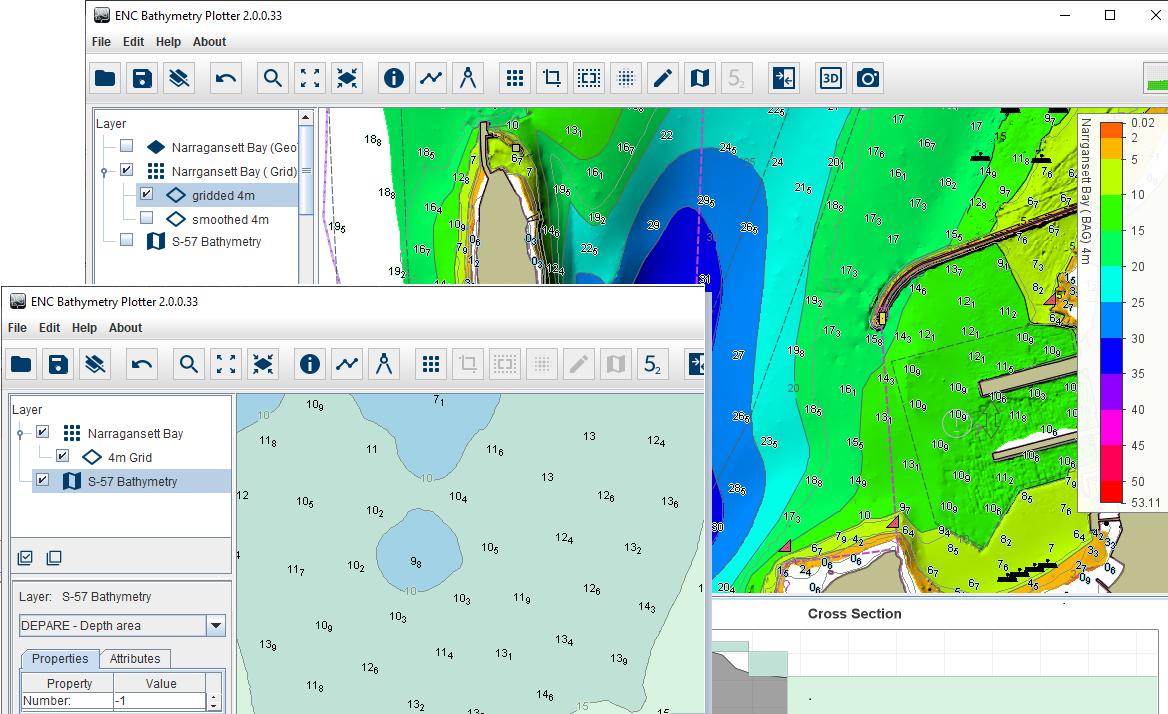
ENC Bathymetry Plotter User Interface*
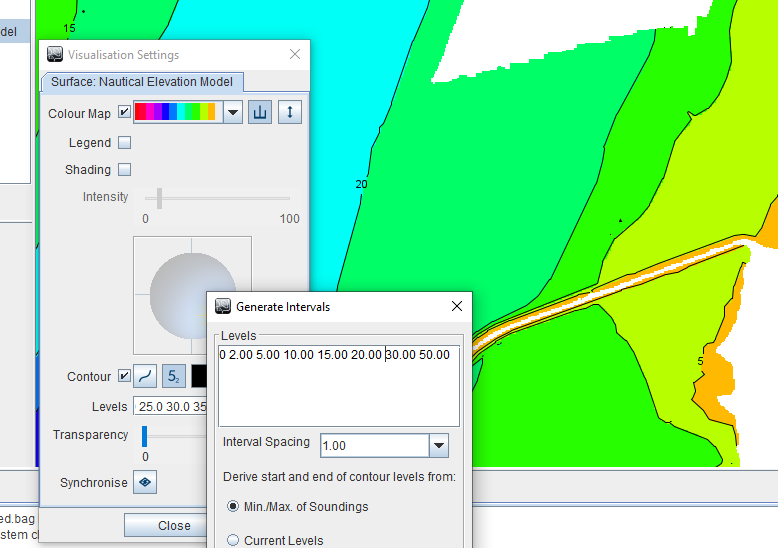
Visualisation Settings
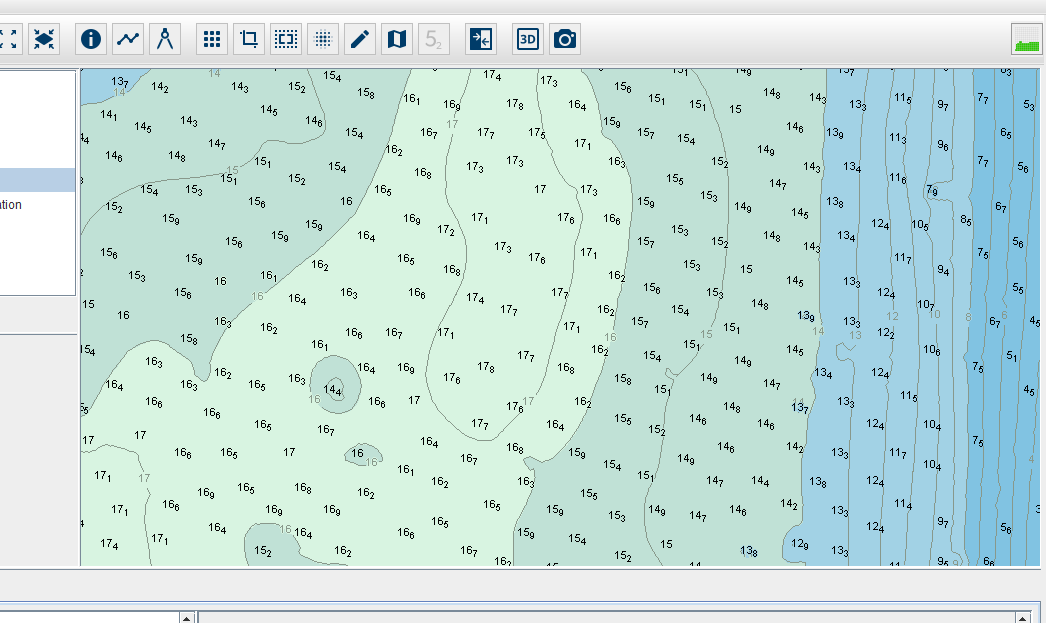
The contouring process is applied to the Nautical Elevation Model (not to the source data). Users only have to set a few parameters (e.g. contour levels). The resulting contour lines have a smooth appearance and do not require any further generalisation. Tools for manual fine-tuning are provided. Moreover, ENC Bathymetry Plotter supports the creation of selected soundings at a configurable density.
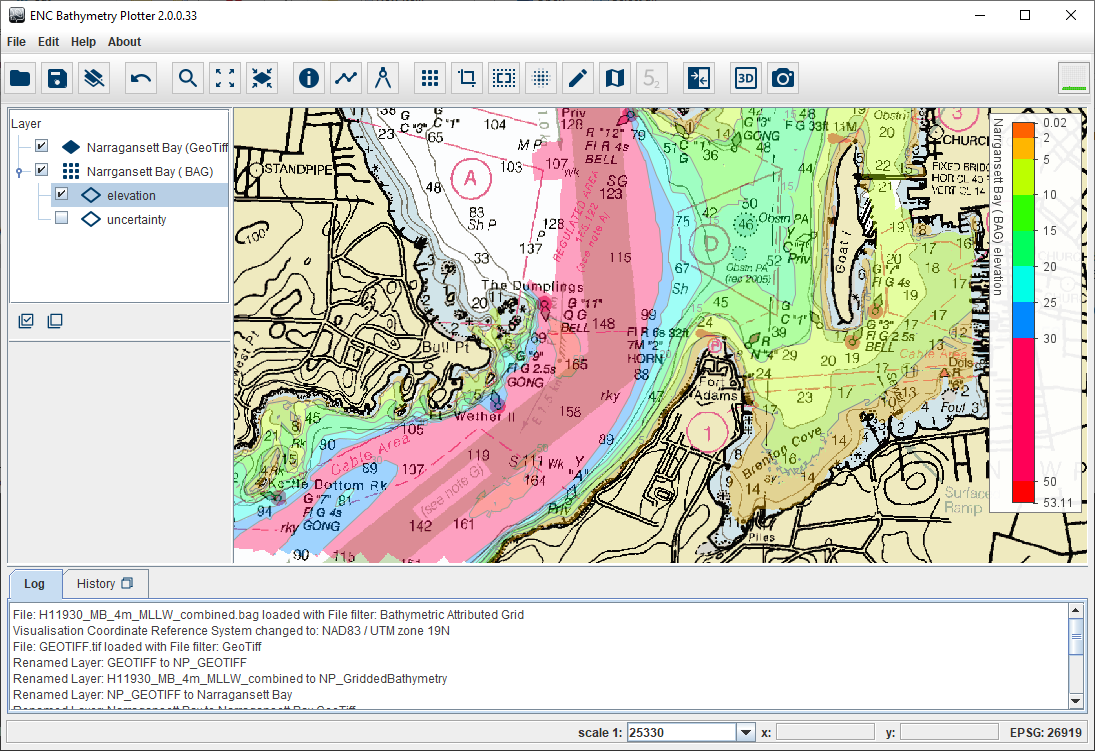
Use of a backdrop in ENC preparation*
ENC Bathymetry Plotter closes a large gap in the chart production workflow. It assists the producer of nautical charts in contour generation and in sounding selection, greatly reducing the manual workload.
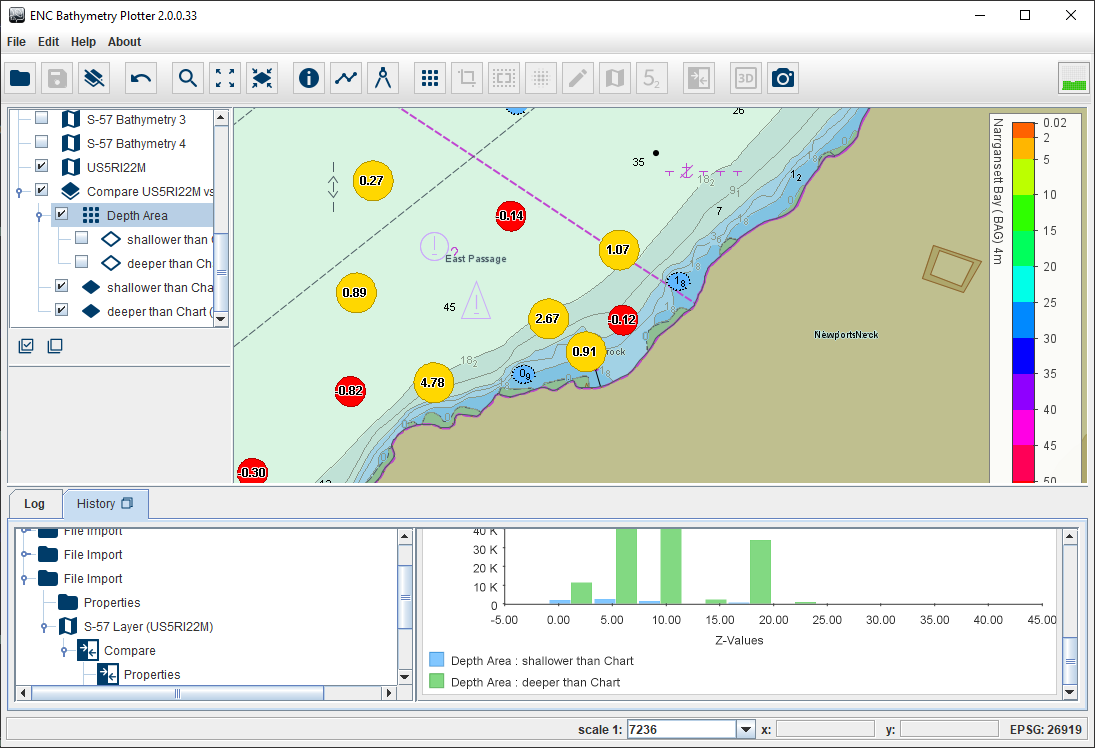
Examples of differences in soundings between input and output chart*
The resulting contours and selected soundings are easily copied into your S-57 data, using ENC Designer or other chart-production software capable of handling S-57 data.
Moreover, ENC Bathymetry Plotter includes the following features: pre-defined chart boundaries; quantified comparison of soundings in the output chart, in relation to the source chart; high-density depth-contours intervals (typically for bENCs/bIENCs but also available for HD ENCs and regular ENCs).
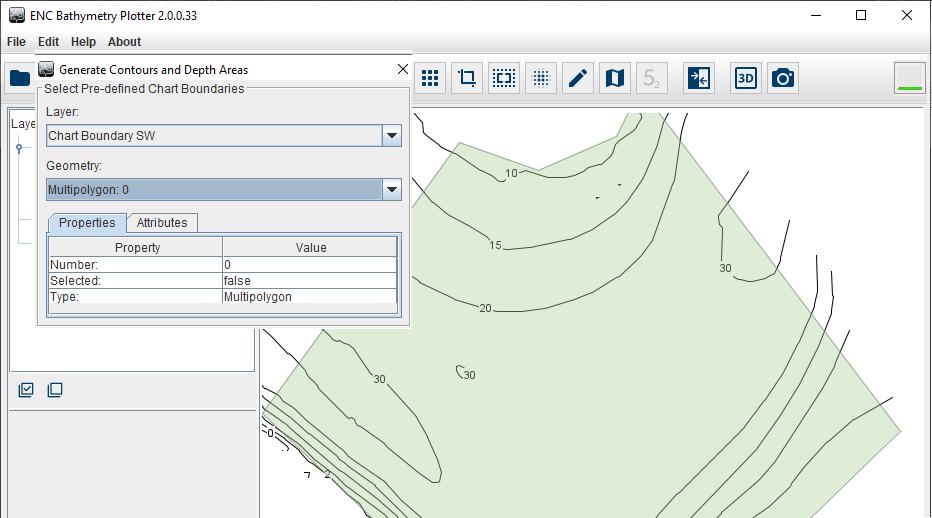
Perfect fit: pre-defined chart boundaries for neighbouring areas
Highlights:
- Smooth progression of tasks: importing the data; creating the model; exporting the results
- Processes gridded bathymetry files (e.g. S-102, BAG) or xyz point-cloud data
- Visualisation settings: many options for customising presentation of the data
- Shoal-biased smoothing and generalisation process
- Easy-to-use, refined function of selecting soundings, building-in preference factors
- Generates a detailed processing report and statistics in PDF format, enabling customers to maintain transparency and traceability in their own QA procedures
- Contour-intervals can be set at any density level (suitable for High Density ENCs, bENCs/bIENCs, regular ENCs)
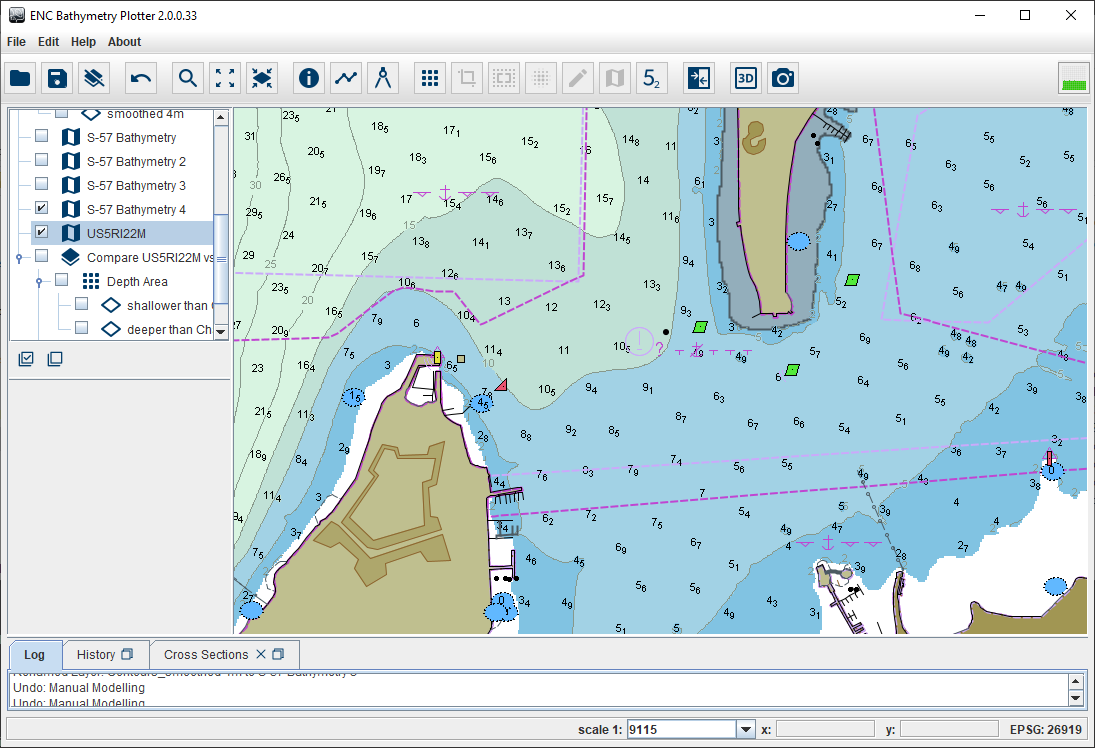
ENC and S-57 New Bathymetry*
HD-ENC production (source data)
HD-ENC production (result)
*This image was created from data provided by courtesy of NOAA.
 BathymetryPlotter Product Sheet
